A venue for results and for Peter Siddle
Stats preview to the Boxing Day Ashes Test at the MCG
S Rajesh
25-Dec-2013
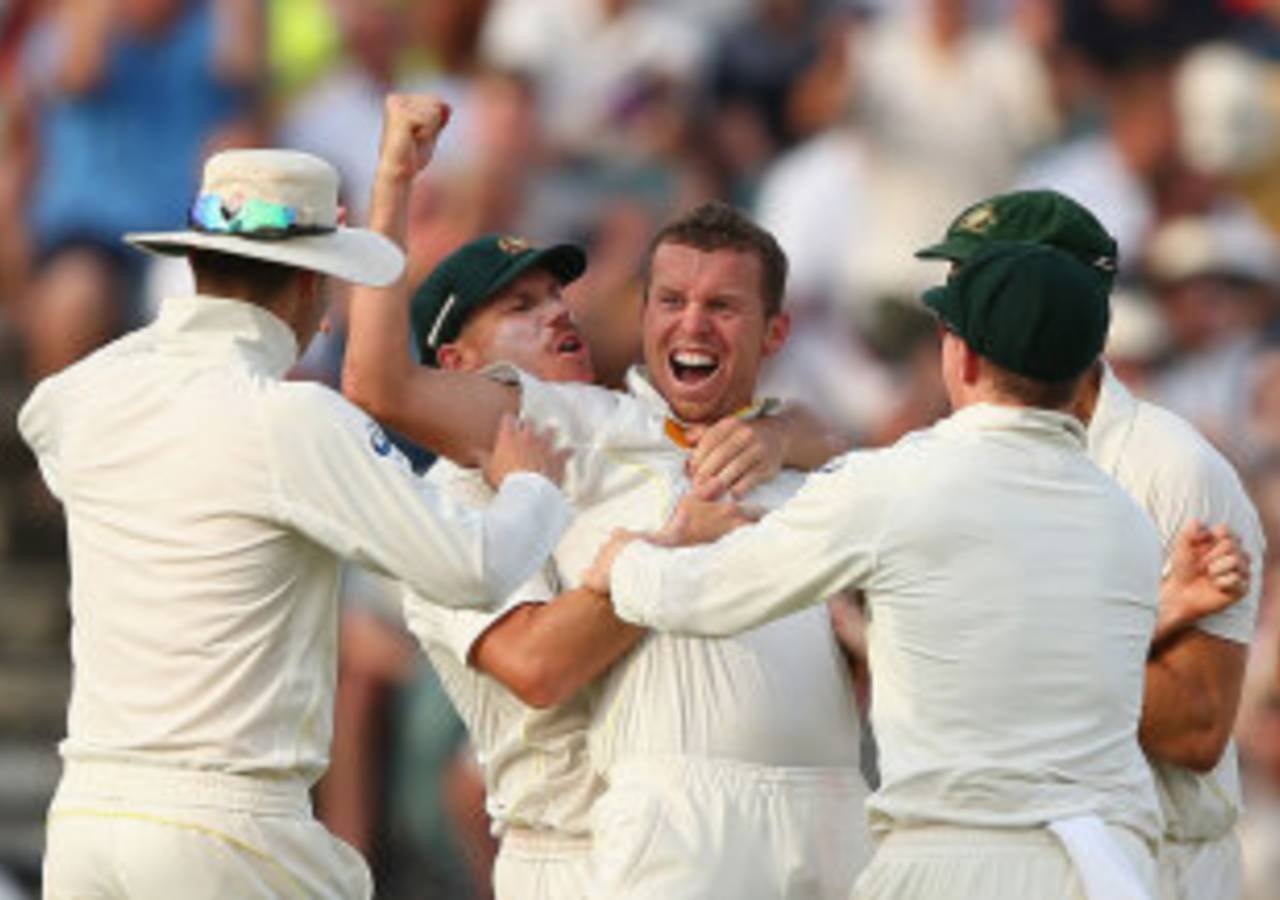
In five Tests at the MCG, Peter Siddle has taken 21 wickets at 22.19, including a haul of 6 for 75 against England in 2010 • Getty Images
The last 15 Tests at the Melbourne Cricket Ground have all produced decisive results - the last draw here was in 1997, against South Africa. Given this stat, and the clear weather forecast, the series scoreline will probably read 4-0 or 3-1 before the new year dawns. Australia have a 12-3 record during this period, but England are the only side to win more than one Test since 1997 - they beat the hosts in 1998 and then again in 2010. The 2010 drubbing was especially embarrassing for Australia, and they were bowled out for 98 in their first innings and saw England finish the opening day on none for 157, which also turned out to be the margin of the innings victory for England. That was Australia's first innings defeat at the ground since 1986.
The memories of that embarrassment will surely keep Australia hungry and motivated despite having already sealed the series with two matches to go. Also, despite Australia's imposing overall record here, they've been beaten twice in their last five Tests: before England's comprehensive win in 2010, they'd also lost to South Africa by nine wickets in 2008. (Click here for the results at this ground since 1990.)
Despite those two recent defeats, Australia's stats here since 2000 are still utterly dominant - they've averaged more than 40 runs per wicket with the bat, and conceded less than 26 with the ball. Their batsmen have scored 16 centuries in these 13 Tests, while opposition batsmen have scored only five.
| Matches | Won | Lost | Drawn | Bat ave | Bowl ave | |
| Australia (overall) | 105 | 60 | 30 | 15 | 32.28 | 27.31 |
| England (overall) | 54 | 20 | 27 | 7 | 27.59 | 29.42 |
| Australia (since 2000) | 13 | 11 | 2 | 0 | 40.21 | 25.73 |
| England (since 1990) | 6 | 2 | 4 | 0 | 25.54 | 34.12 |
The MCG is one of two home venues where Shane Watson has scored a Test century - in fact, it's the ground where he scored his first century, 120 not out against Pakistan in 2009. For Michael Clarke, though, it hasn't been such a great batting ground: he scored his first Test century here last year, in his 13th Test innings; in his previous 12 innings here he'd averaged 36.50.
The MCG has also been a poor venue for two of England's top batsmen. Kevin Pietersen has managed 73 runs from three innings, while Ian Bell has scores of 7, 2, and 1 from his three innings here.
| Batsman | Tests | Runs | Average | 100s/ 50s |
| Michael Clarke | 8 | 471 | 42.81 | 1/ 2 |
| Shane Watson | 3 | 355 | 88.75 | 1/ 3 |
| Mitchell Johnson | 5 | 178 | 44.50 | 0/ 1 |
| Brad Haddin | 4 | 143 | 23.83 | 0/ 1 |
| David Warner | 2 | 104 | 34.67 | 0/ 1 |
Peter Siddle has the least wickets among Australia's fast bowlers so far in this series, but at the MCG he has been the top star, taking 21 wickets in five Tests at 22.19. The last time the two teams played at this ground, Siddle was the only Australian to emerge with his reputation enhanced, taking 6 for 75 from 33 tireless overs, even as England amassed 513. Mitchell Johnson went for plenty in that match - 2 for 134 from 29 overs - but he achieved his best MCG figures when he last played there, taking 6 for 79 against Sri Lanka in 2012.
| Bowler | Tests | Wickets | Average | Strike rate | 5WI/ 10WM |
| Peter Siddle | 5 | 21 | 22.19 | 46.1 | 1/ 0 |
| Mitchell Johnson | 5 | 19 | 26.52 | 53.3 | 0/ 0 |
| Nathan Lyon | 2 | 4 | 32.50 | 45.7 | 0/ 0 |
In the last eight Tests at the MCG, fast bowlers have done much better than spinners, averaging 27 runs per wicket with five five-fors, two of those by Dale Steyn in one match. Spinners have conceded more than 41 runs per wicket, and two of the three five-fors taken by them during this period were by wristspinners, Shane Warne and Anil Kumble. Nathan Lyon, Australia's specialist spinner in the current team, has bowled only 30.3 overs in the two Tests he has played here, which indicates how dominant Australia's fast bowlers have been in these matches.
| Wickets | Average | Strike rate | 5WI/ 10WM | |
| Pace | 198 | 27.41 | 53.9 | 5/ 1 |
| Spin | 54 | 41.55 | 79.2 | 3/ 0 |
Teams winning the toss have batted first seven times in the last eight Tests, but have won only four of the seven times when they've chosen to bat. In these eight games, teams batting first and fielding first have won four times each, which suggests the toss hasn't had that much impact on the result of the match.
The average runs per wicket is the highest in the second innings, which suggests the second day is the best one for batting at this venue. In the last eight Tests, teams have topped 330 five times in the first innings, but there've also been three scores of less than 160. In the second innings, four times in the last eight years teams have topped 400, with England's 513 in 2010 being the highest. However, the averages have dropped significantly in the third and fourth innings, with the fourth-innings average dropping to 23.
| 1st innings | 2nd innings | 3rd innings | 4th innings |
| 30.56 | 36.22 | 28.02 | 23.04 |
S Rajesh is stats editor of ESPNcricinfo. Follow him on Twitter