Spin and partnerships turn it India's way
Stats review of the three-Test series between India and New Zealand
Siddhartha Talya
08-Apr-2009
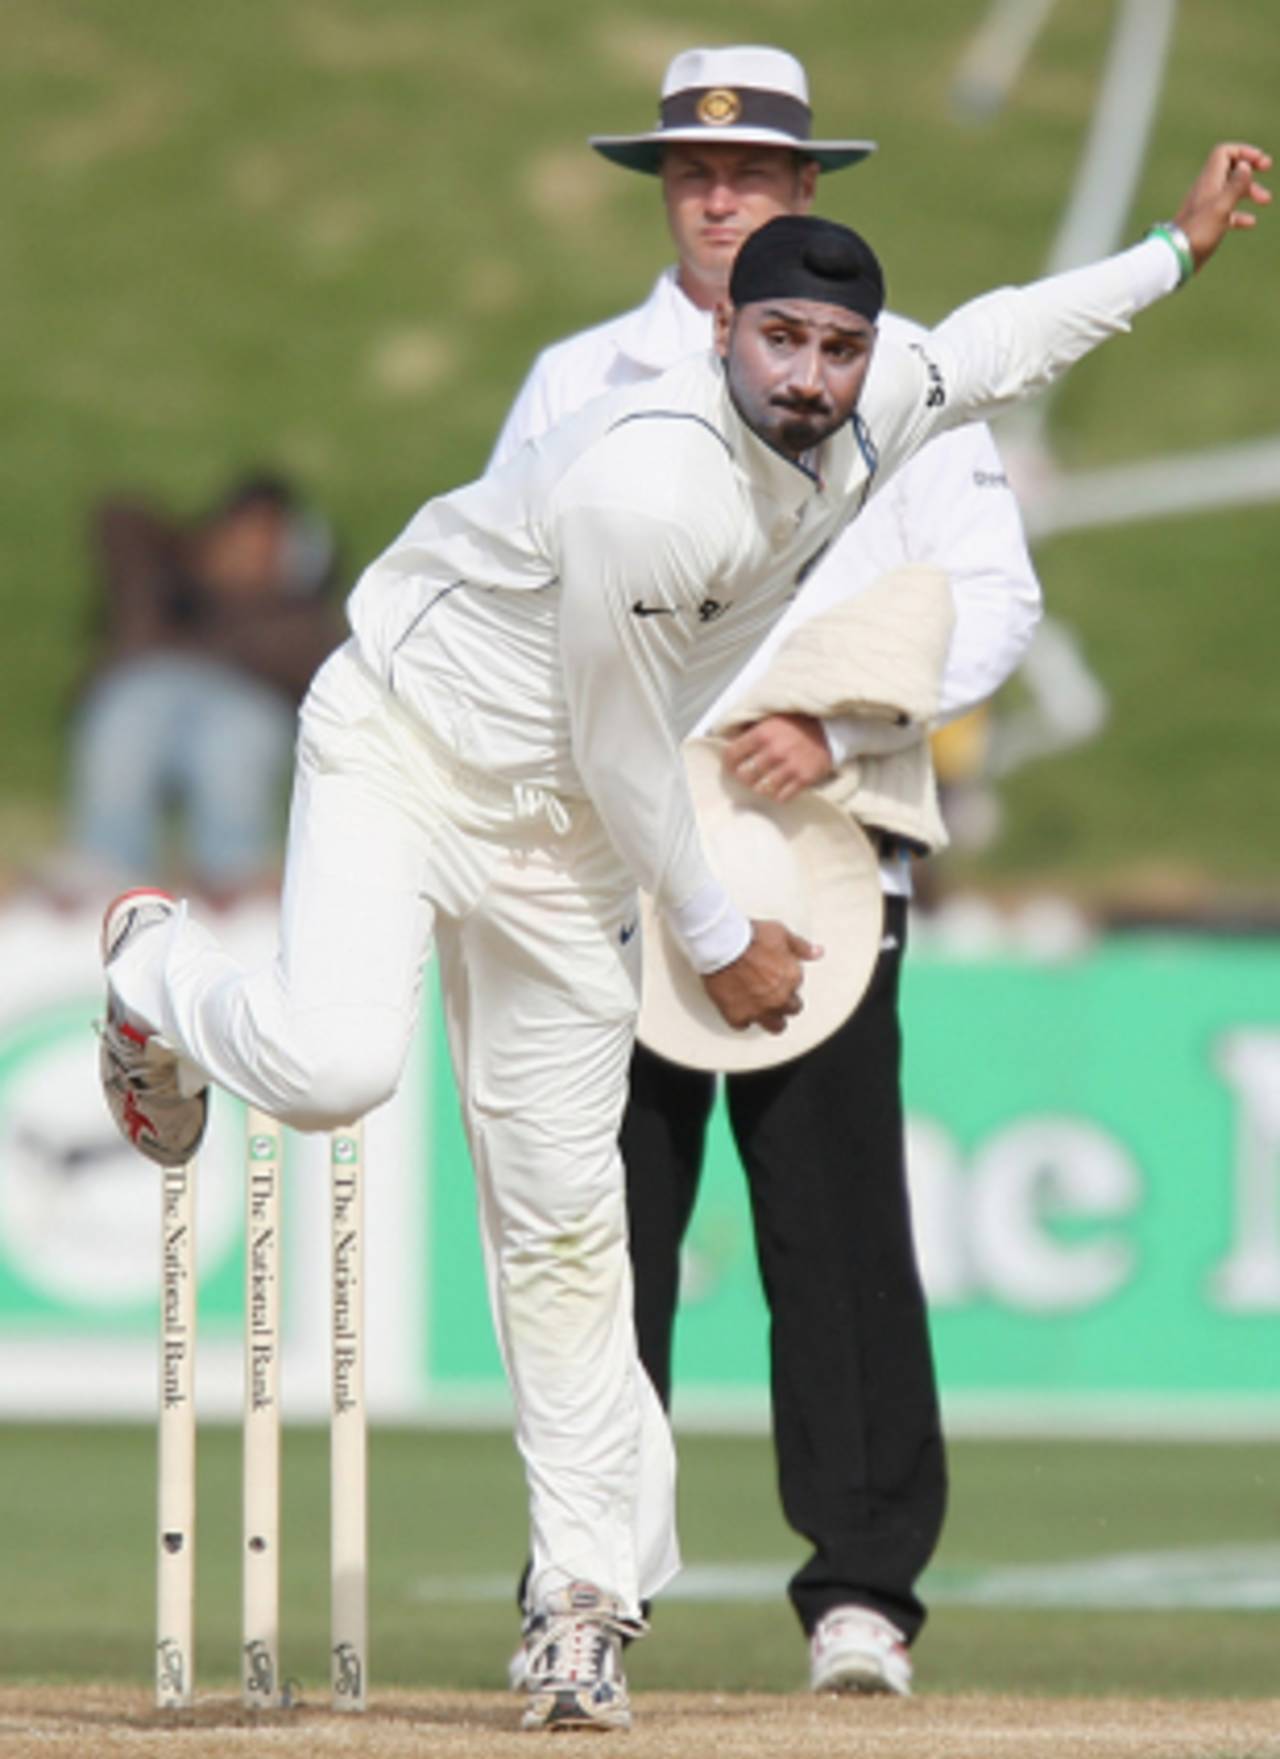
Harbhajan Singh spearheaded India's bowling attack, emerging as the highest wicket-taker in the series, but his counterpart, Daniel Vettori, was well below-par. • Getty Images
India were expected to win the Test series going into the tour, and though they met expectations, the final 1-0 scoreline, as a result of the rain-affected final day in Wellington, did not appropriately reflect the gulf between the two teams. India had a far more experienced team, riding on a wave of success after wins at home against Australia and England while New Zealand had performed poorly in Tests in 2008. The most glaring differences lay in the batting, with India's top six outclassing New Zealand's, particularly in the second innings.
Gautam Gambhir was the star for India, emerging as the highest-run getter in the series. His tally of 445 runs is the highest for an Indian batsman in a three-Test series outside the subcontinent, and his best overseas performance in terms of averages. India's big three, Sachin Tendulkar, Rahul Dravid and VVS Laxman also cashed in, with each averaging over 60. Tendulkar scored a fifty-plus score in each Test - his 160 in Hamilton being his best effort - while Laxman's highlight was his match-saving century in Napier. Dravid was highly consistent, notching up four half-centuries, and recording his best series average in close to two years. MS Dhoni and Yuvraj Singh bettered their records with some fluent batting further down the order but the one name conspicuous in its absence from the list of India's top performers was Virender Sehwag, who averaged just 28.
India averaged 52.51 overall for each wicket, a difference of more than 17 runs compared to New Zealand. If one focuses only on the performances of the teams in the second innings, the difference increases to 55 in India's favour, proving decisive in the outcome. In Hamilton, New Zealand were bowled out for 279 after India had gained a first-innings lead of 241, and in Wellington, they were on the brink of defeat with eight wickets down chasing 617 before rain came to their rescue. India's statistics were boosted by their defiance in Napier, where they saved the Test after following on, and a combined batting display in the final Test where they consolidated on a sizable lead to set the hosts an improbable target.
| India | New Zealand | |
| Overall | 52.51 | 35.21 |
| Second Innings | 86.27 | 31.11 |
With more success from their top six, India's top and middle-order partnerships invariably were far more productive. However, New Zealand had serious problems up the order, losing their first three wickets consistently with the score under three figures in all their five innings. The average partnership for the first three wickets for the hosts was under 25, with the likes of Tim McIntosh, Martin Guptill, and Daniel Flynn struggling to get going. The difference in the statistics for partnerships in the second innings is starker, with the home team faltering each time, though in Wellington, Ross Taylor and James Franklin kept India at bay for a considerable while. For India, Sehwag's relatively disappointing performance in the series did slightly dent his opening record with Gambhir, though partnerships for subsequent wickets, particularly those involving the big three together with Gambhir, helped their team dominate with the bat.
| Team | Overall | For wickets 1-6 | 100s/50s | 2nd innings - For wickets 1-6 | 100s/50s |
| India | 52.51 | 64.21 | 6/9 | 91.20 | 4/3 |
| New Zealand | 35.21 | 35.33 | 3/2 | 33.16 | 1/1 |
Equally important was the performance of the two specialist spinners Harbhajan Singh and Daniel Vettori. On wickets that are traditionally more conducive to pace, Harbhajan spearheaded India's bowling attack, emerging as the highest wicket-taker in the series, but his counterpart was well below-par.
New Zealand's fast bowlers tried hard, but without adequate support from their ace spinner, whom India negotiated easily, their bowling failed to measure up against a formidable batting line-up. Only Chris Martin, who picked his 150th Test wicket during the series, proved penetrative, grabbing 14 wickets at 32.71. While India's pace bowlers handed their team the initiative, bowling out the opponents cheaply in the first innings, Harbhajan preserved his best in the second - his 6 for 63 in Hamilton was his best performance overseas - with the track taking more turn after his batsmen had provided him the cushion of a sizable lead.
| Player | Wickets | Average | Strike Rate | Economy Rate |
| Harbhajan | 16 | 21.37 | 55.3 | 2.31 |
| India's fast bowlers (Zaheer, Munaf and Ishant) | 27 | 40.28 | 69.33 | 3.48 |
| Vettori | 7 | 52.28 | 117.1 | 2.67 |
| New Zealand's fast bowlers (Martin, O'Brien, Southee, Mills, Franklin) | 27 | 113.6 | 182.26 | 4.04 |
However, the hosts, still adapting to a new phase with a young team will take heart from their performance in Napier, and some individual successes that will bode well for them in the coming future. New Zealand managed six centuries in the series - only the second time they have done so - and yet, lost. India had four. The Napier Test also witnessed a host of records being broken, and marked a return to form of two of their key performers - Taylor, who put behind him a lean phase to score 151, and Brendon McCullum who, until now, had failed to replicate his ODI success in the Test arena but struck gold with a quick ton. The biggest individual success for New Zealand, though, was Jesse Ryder, who finished the series with 327 runs, including a maiden Test century in the first Test and a double in the second.
Head-to-Head contests
Harbhajan was particularly successful against Taylor, dismissing him thrice. Ryder played him well, though fell to him on both occasions in the second innings. McCullum, during his century in Napier, and Vettori, in Hamilton, got runs against him, while James Franklin struggled. Zaheer was highly effective against the top order, dismissing Guptill, McIntosh and Flynn thrice each.
Vettori was generally negotiated well by the Indian batsmen, especially Gambhir who scored 101 against him without being dismissed. He was relatively successful against Dravid, and Sehwag, whose audacious waft off his bowling in the Napier Test deprived India of the start it needed to scale a mammoth New Zealand score of 619. Chris Martin had more success against the Indian middle order, getting rid of Yuvraj thrice, and Tendulkar and Laxman on two occasions. However, he came in for some harsh treatment from Sehwag who scored 56 at almost a run-a-ball.
| Batsman | Bowler | Runs | Balls | Dismissals | Average |
| Jesse Ryder | Harbhajan Singh | 81 | 187 | 2 | 40.50 |
| Ross Taylor | Harbhajan Singh | 63 | 151 | 3 | 21 |
| Brendon McCullum | Harbhajan Singh | 58 | 112 | 1 | 58 |
| Daniel Vettori | Harbhajan Singh | 44 | 117 | 1 | 44 |
| James Franklin | Harbhajan Singh | 38 | 126 | 2 | 19 |
| Martin Guptill | Harbhajan Singh | 3 | 44 | 2 | 1.5 |
| Jesse Ryder | Zaheer Khan | 80 | 111 | 2 | 40 |
| Ross Taylor | Zaheer Khan | 72 | 123 | 0 | - |
| Martin Guptill | Zaheer Khan | 61 | 77 | 3 | 20.33 |
| Tim McIntosh | Zaheer Khan | 29 | 95 | 3 | 9.66 |
| Daniel Flynn | Zaheer Khan | 22 | 92 | 3 | 7.33 |
| Gautam Gambhir | Daniel Vettori | 101 | 196 | 0 | - |
| Rahul Dravid | Daniel Vettori | 63 | 194 | 2 | 31.50 |
| Sachin Tendulkar | Daniel Vettori | 47 | 130 | 1 | 47 |
| Harbhajan Singh | Daniel Vettori | 37 | 40 | 0 | - |
| Gautam Gambhir | Chris Martin | 73 | 171 | 1 | 73 |
| Sachin Tendulkar | Chris Martin | 87 | 120 | 2 | 43.50 |
| Rahul Dravid | Chris Martin | 63 | 176 | 1 | 63 |
| Virender Sehwag | Chris Martin | 56 | 59 | 1 | 56 |
| VVS Laxman | Chris Martin | 37 | 85 | 2 | 18.50 |
| Yuvraj Singh | Chris Martin | 34 | 54 | 3 | 11.33 |
Siddhartha Talya is an editorial assistant at Cricinfo