"We probably needed about 500 tonight the way they played. That would have been a good game," Daniel Vettori said ruefully after being comprehensively outclassed by India's incredible batting power in the fourth ODI. He might have been exaggerating, but not by much: in 23.3 overs, India had motored to 201 without loss - this even after being relatively subdued in the last few overs, since the target was well within reach. At a rate of 8.55 per over - which is how quickly they were going when the rains intervened - they would have got 402 in 47 overs. Add the urgency of slog overs with wickets in hand, and 450 wasn't an unreasonable score for India to achieve in 47 overs.
It might be thrilling for spectators and for the batsmen, but such games offer little joy for bowlers. And in New Zealand this isn't a one-off either: not only in this series, over the last few years bowlers have been increasingly marginalised in ODIs in this country. Sample this: in
84 innings here since the beginning of 2005, teams have scored in excess of 6.5 runs per over 19 times, which is a whopping 22.6%. The corresponding percentage in India is 9.03, in Pakistan 15.55, in Australia 8.11, South Africa 9.43 and West Indies 12.35 (despite the number getting inflated by strong teams playing minnows in the 2007 World Cup).
This astonishing run-barrage is a relatively recent phenomenon in New Zealand. Indian fans will remember the last time their team toured, when the ball jagged around viciously at almost all the venues, making ordinary seamers look deadly. That might have been an extreme, but generally pitches in the country used to be sluggish, and quick scoring wasn't easy despite the relatively short boundaries.
The table below, which compares year-wise ODI stats in New Zealand since 2000, further illustrates this point. The year 2000 was an exception, but otherwise, till 2004, the average runs were pretty low. Sixes were pretty rare too: in 2003 there was one hit every 198 balls; in 2002 that figure was 129, but this year the ball has cleared the boundary every 40 deliveries, on an average. In fact, the ten
fastest century partnerships in New Zealand have all happened since 2005, of which five have come in this series alone.
There used to be a time when the highest scores happened in the subcontinent (especially in India and Pakistan), but over the last four years that mantle has clearly been taken by New Zealand. In 42 ODIs since 2005, teams have averaged almost 34 runs per wicket and 5.36 per over, both of which are higher than in any other country. The other interesting aspect is the rate at which the ball goes over the boundary - it happens once every 57 balls, which is about 20 balls better than the next-best country, and almost three-and-a-half times better than Sri Lanka, where, on an average, a six is hit every 33 overs. The New Zealand average of 56.64 balls per six converts into more than five sixes per innings.
Despite the short boundaries, it seems it's better to be a spinner in New Zealand than a fast bowler. Though pace has accounted for more wickets, they have come at a higher cost and a poorer economy-rate.
Not surprisingly, the bowlers who head the list for best economy-rates in New Zealand are the two best spinners going around today. Vettori's stats are particularly remarkable, for he has maintained an economy-rate of 3.71 after playing
37 games in New Zealand, and often against batsmen who are extremely proficient against spin. Among the fast bowlers, Shane Bond and Chaminda Vaas have done better in New Zealand than in other countries during this period. Nathan Bracken's economy-rate in this country is significantly higher than his overall rate, but he went at 5.34 per over when teams were scoring 300-plus for fun during the Chappell-Hadlee Series in 2007.
A look at the
ground stats in New Zealand during this period indicates that Seddon Park in Hamilton is the worst venue for bowlers - the average runs per over in four games here is 6.67, and the average runs per wicket 51.37. Napier is slightly better, but the best venue for bowlers in this country is scenic Queenstown, where, apart from the wonderful view, bowlers also get to see batsmen walking back to pavilion, or playing dot-balls, more often than at other grounds.
That was then, this is now
The ongoing series is as different as it could be from when India toured New Zealand last. Some numbers to illustrate the two ends of the spectrum:
The one similarity is
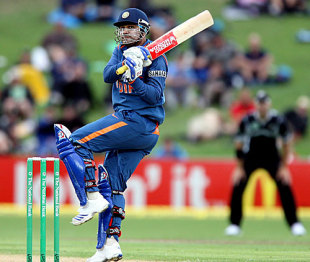
Virender Sehwag's success : the two hundreds scored in the 2002-03 series were both by him, though the conditions meant that even his strike-rate in that series dropped to 78.47 per 100 balls. In the ongoing series, it's soaring at 150.58.
