Perhaps numbers never do reveal the full story, but they tell a large part of it. Every Friday, The Numbers Game will take a look at statistics from the present and the past, busting myths and revealing hidden truths:

|

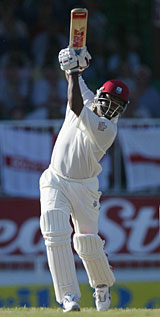
No-one drives it through the covers quite like Brian Lara does
© Getty Images
|
|
So who's the best cover-driver in world cricket today? Go for an opinion poll, and the responses will be varied: many will opt for the elegance and effortlessness of Damien Martyn's version, played with minimal footwork but outstanding hand-eye co-ordination, timing, and placement. Others might prefer Michael Vaughan's flourish and grace. And what about Brian Lara's extravagant execution of the stroke, or Marvan Atapattu's classical, copybook variety?
A subjective analysis will reveal many opinions, but The Numbers Game decided to go in for objective parameters to judge the masters of each stroke. Unlike in a subjective debate, this analysis ignores the technical excellence, the panache and the sheer elegance with which a stroke is executed; it examines the effectiveness of the execution: the runs it fetches, and its risk-factor for a batsman - the number of times he's been dismissed playing that stroke. With the help of Cricinfo's ball-by-ball data-capture mechanism, which records each delivery in international cricket in 16 different ways, it becomes possible to record each stroke and its outcome. Over the next few weeks, this column will check out each stroke and the batsmen who play it the best.
And the winner of the cover-drive contest is Brian Lara. Since September 2001, when the ball-by-ball data-recording system came into being, Lara has played the stroke 358 times for 652 runs in Tests - that's a rate of 1.82 runs per shot. But even more impressively, he has only been dismissed once while playing the stroke, giving him a cover-drive average of 652. The next two entries are triumphs for the coaching manual - both Jacques Kallis and Rahul Dravid play the stroke almost exactly as defined in the book.
How about some of the other exponents who have us digging into the thesaurus for superlatives? Damien Martyn has 500 runs from the stroke off 312 balls (strike rate 160.26), but has been dismissed playing it three times, making his average 166.67. Atapattu's 493 runs off the stroke (strike rate 203) has been at the cost of five dismissals, giving him a cover-drive average of 98.60. And while Vaughan playing the cover-drive is among the most gorgeous sights in cricket, it can also be frustrating - it has cost him his wicket eight times, for an average of only 73.75. Among the top 20 cover-drivers (in terms of aggregate), Vaughan's average puts him in 19th place, just ahead of Sachin Tendulkar (383 runs in 283 balls, seven times dismissed, average 54.71). Five of Tendulkar's seven dismissals came before the Sydney Test of 2003-04, when he completely cut out that stroke en route to an unbeaten 241. Before Sydney, Tendulkar's cover-drive average had dipped to 48.2 (241 runs, five times out); since then, it has climbed to 71.
Top 10 cover-drivers
(in terms of average, min. runs 350) |
Cover-drive runs/ balls/ outs |
Strike rate |
Average |
| Brian Lara |
652/ 358/ 1 |
182.12 |
652.00 |
| Jacques Kallis
| 671/ 463/ 2 |
144.92 |
335.50 |
| Rahul Dravid |
613/ 376/ 2 |
163.03 |
306.50 |
| Gary Kirsten
| 414/ 211/ 2 |
196.21 |
207.00 |
| Marcus Trescothick |
609/ 292/ 3 |
208.56 |
203 |
| Herschelle Gibbs
| 723/ 341/ 4 |
212.02 |
180.75 |
| Damien Martyn |
500/ 312/ 3 |
160. 26 |
166.67 |
| Matthew Hayden
| 479/ 278/ 4 |
172.30 |
119.75 |
| Mark Butcher |
469/ 268/ 4 |
175.00 |
117.25 |
| Ramnaresh Sarwan
| 547/ 343/ 5 |
159.48 |
109.40 |
Next week: The defence masters
* * * * * * * * * * * * * * *
When left is right
Following the column last week on top performers in the subcontinent, it was pointed out that all the leading batsmen were left-handers. This raised an interesting question: are left-handers more successful than right-handers on the subcontinent, or are they just better players all over the world?
The stats are revealing: the lefties have had more success all over the world, not just in Asia. A look at the figures for all the players who bat in the top seven of their team's line-up reveals that left-handers average around six runs more per innings on the subcontinent and outside. (The stats exclude matches in Bangladesh.)
|
Runs |
Innings |
Average |
| Left-handers in subcontinent since 1995 |
41,819 |
1289 |
34.91 |
| Left-handers outside subcontinent since 1995
| 93,104 |
144.92 |
34.83 |
| Right-handers in subcontinent since 1995 |
80,948 |
2978 |
29.01 |
| Right-handers outside subcontinent since 1995
| 163,234 |
6082 |
28.63 |
In fact, looking at averages over ten-year periods since 1965, it's clear that left-handers have, on an average, been more successful over the last 40 years. The gap narrowed between 1975 and 1984, but since then it has widened again, and since 1995 it's been more than six runs. With the likes of Brian Lara, Adam Gilchrist, Justin Langer, Andrew Strauss, and Graeme Smith straddling the world scene, that difference might go up even further over the next few years.
| Period |
Right-handers' average |
Left-handers' average |
| 1965-74 |
35.93 |
39.54 |
| 1975-84
| 35.09 |
37.06 |
| 1985-94 |
35.69 |
38.87 |
| 1995-
| 28.74 |
34.86 |
S Rajesh is assistant editor of Cricinfo. For some of the data, he was helped by Arun Gopalakrishnan, the operations manager in Cricinfo's Chennai office
